A/B Testing Nutrients: Simple Experimental Design for Home Grows


Read This First (Why a cannabis AB test makes you a smarter grower)
You want bigger buds, cleaner flavor, and fewer problems. Cool—let’s get you there the simple way: run a cannabis AB test. That’s just a fancy way to say you’ll grow two groups of the same plants but feed them different nutrients (A vs. B), then compare the results. You hold everything else steady—light, water, pots, temps—so you can tell what actually made the difference.
Think of it like taste-testing two chocolate chip cookies baked the same way, except one uses butter and one uses oil. When the cookies taste different, you know which ingredient did it. Easy-peasy.
Below, you’ll learn exactly how to plan, run, measure, and judge a cannabis AB test at home—even in a tent. You’ll set up clean comparisons, avoid common traps, and make decisions based on real data, not guesswork. If you grow in Canada or the United States, this works the same—just follow your local laws and keep it personal and ethical.
What A/B Testing Means in Your Grow
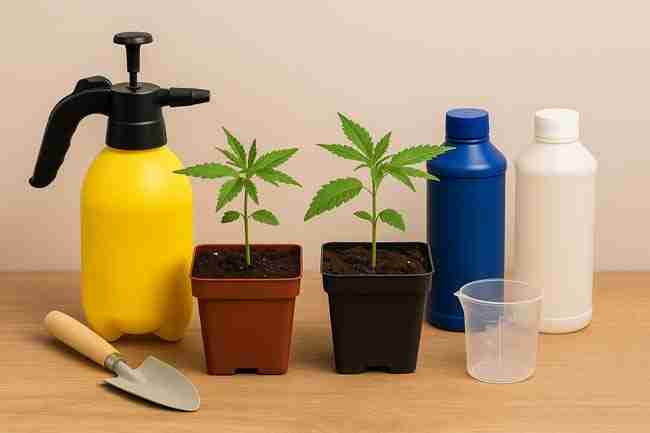
An A/B test compares two choices:
- Group A: Your control (the normal nutrient plan you trust).
- Group B: Your challenger (a different nutrient line or an adjusted feeding plan).
The core idea
- Change one thing only (the nutrient plan).
- Keep everything else the same.
- Watch what happens, write it down, and decide with numbers.
Why AB beats “vibes”
Your eyes can fool you. Your hopes can too. A cannabis AB test cuts through that. Data doesn’t argue, it just sits there and tells you the truth.
Pick a Clean Question (Your Hypothesis)
Before you mix a single milliliter, write your test question like a kid would:
- “Does Nutrient B give me more yield than Nutrient A?”
- “Does Cal-Mag brand B stop my rusty leaf spots better than brand A?”
- “Does a simpler two-bottle feed grow as frosty as a three-part?”
Be specific. If your question is fuzzy, your answer will be foggy.
Good hypothesis examples
- “Nutrient B will increase dry yield per plant by at least 10% vs Nutrient A.”
- “Nutrient B will reduce tip burn incidents by half vs Nutrient A.”
- “Nutrient B will improve bud density score from 3 to 4 (on a 1–5 scale).”
Keep It Fair: Control the Variables That Matter Most
If one group gets more light or a bigger pot, your test is toast. Hold these steady:
Environment
- Light intensity: Same fixture height and output for both groups (measure PPFD/lux at canopy).
- Photoperiod: Same schedule (e.g., 18/6 veg, 12/12 flower).
- Temperature & humidity: Keep within a tight band; track daily highs/lows.
- Airflow & CO₂: Even distribution across the tent.
Setup
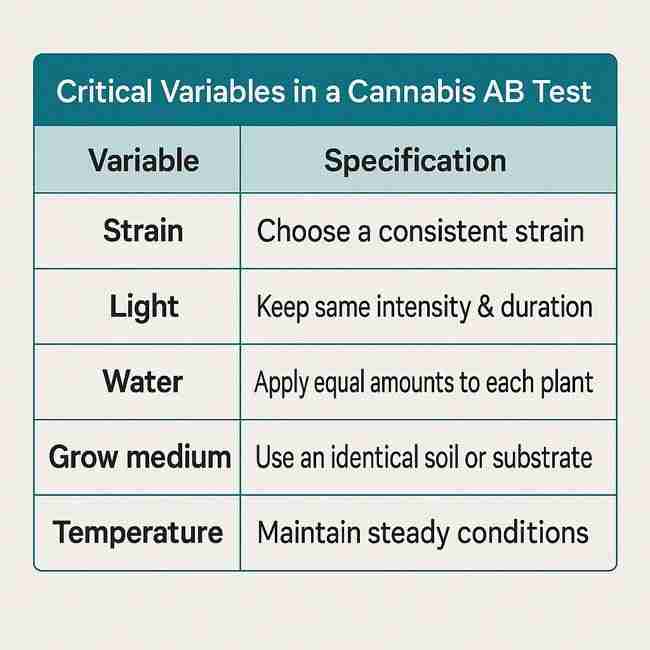
- Medium: Same brand/type (soil, coco, rockwool, DWC).
- Pot size & style: Identical containers.
- Water source: Same tap/RO mix; same pH after mixing; track EC/TDS.
- Irrigation timing & volume: Same schedule and target runoff (if applicable).
Plants
- Clones beat seeds for testing (genetics are consistent). If seeds are your only option, pick the most uniform ones and increase replicate count.
How Many Plants Per Group? (Replicates)
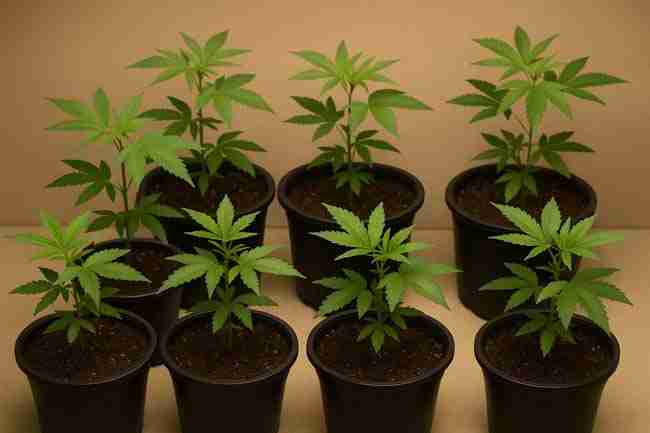
Yes, you can learn from just one plant vs. one plant. However, a small swing from genetics or a tiny microclimate can trick you. Use replicates—multiple plants in each group.
Quick guideline for home grows
- Minimum: 3 plants per group (A=3, B=3)
- Better: 4–5 per group
- Chef’s kiss: 6–8 per group (when space allows)
Table: Simple replicate guide
| Replicates per Group | When to Use | Confidence Feel | Notes |
|---|---|---|---|
| 1 | Tight space only | Wobbly | Directional, not reliable |
| 3 | Small tents | Decent | Good for “Is A better than B?” |
| 5 | Medium tents | Solid | Smoother averages |
| 7–8 | Larger rooms | Strong | Helps tame plant-to-plant noise |
Randomization (No Favorites)
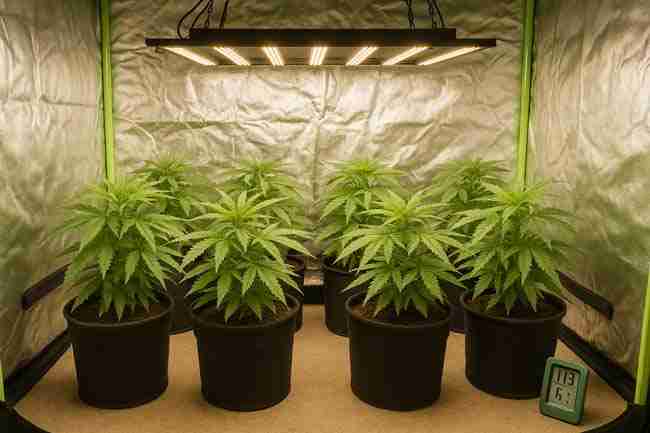
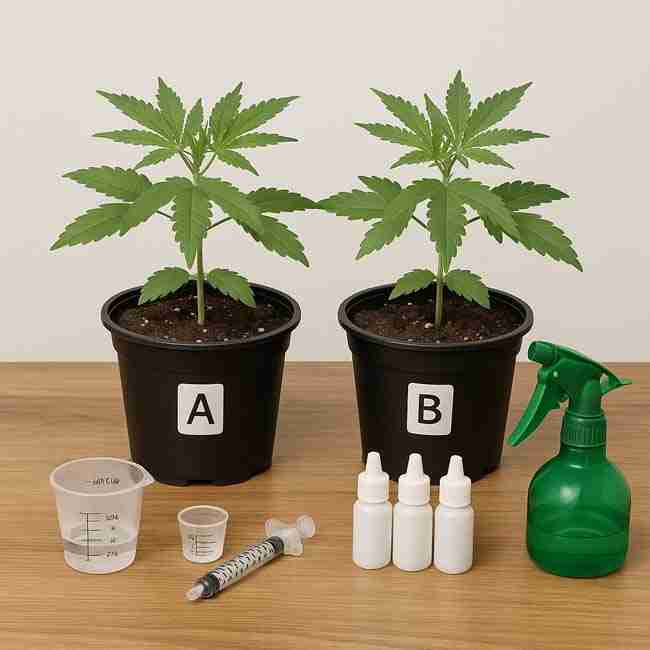
Don’t cluster all A plants on the left and all B plants on the right. Randomize positions so light hotspots or drafts don’t bias a group. Easiest trick: label cups A1, B1, A2, B2… then shuffle their positions or rotate the plants every few days.
The Two Nutrient Plans (A vs. B)
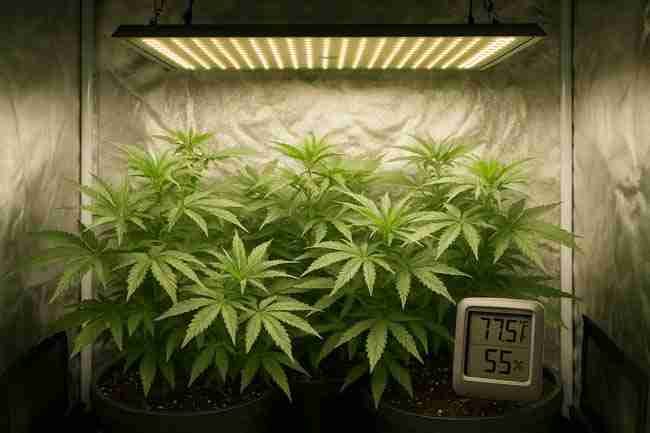
Keep the feeding schedules clean and readable. Print them. Tape them to the wall.
Group A (Control)
- Use the exact nutrient plan you already trust (brand, dose, additives).
- Stick to your normal mixing order and water volume.
Group B (Challenger)
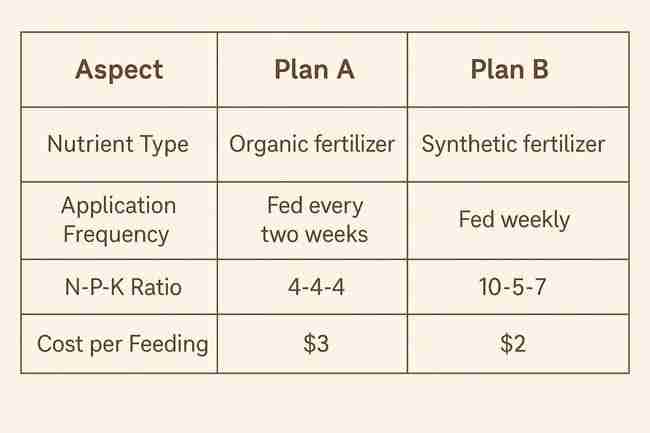
- Use either a different brand or a different dosing strategy of the same brand.
- Change only one thing (e.g., “half-strength bloom booster” or “swap Cal-Mag brand”).
Measurement Kit (Your Tiny Lab)
You don’t need a white coat, just a few reliable tools.
Must-have tools
- pH meter (calibrate weekly; keep storage solution fresh)
- EC/TDS meter (for nutrient strength and runoff readings)
- Thermo-hygrometer (daily highs/lows)
- Light meter (lux meter or phone app + reference; PPFD if possible)
- Graduated cylinder / measuring spoons (precise dosing)
- Scale (grams for dry yield)
- Notebook or spreadsheet (daily logs with dates)
- Labels & marker (A1, A2, B1, B2, etc.)
- Camera/phone (same angle/time each week)
Calibration rhythm
- pH and EC meters: verify weekly.
- Light height: check after stretch and any rearrangements.
Baseline Water & Mixing Order
Start by testing your source water:
- EC/TDS (write it down)
- pH (write it down)
Standard mixing order (simple, reliable)
- Water
- Cal-Mag (if used)
- Base nutrients (grow/micro/bloom per label)
- Additives (silica first if used; microbes last if used)
- Stir between steps, then measure EC and pH
- Adjust pH last
Note: Whatever order you use, keep it identical for both groups.
Your Week-by-Week Run Book
Consistency wins. Here’s a simple rhythm to follow.
Veg (Week 1–4, adjust to your schedule)
- Feed on your normal cadence.
- Data points: plant height, node count, stem thickness, EC in/out, pH, notes on tips/leaf color.
- Keep defoliation and training (LST, topping) identical across groups.
Early Flower (Week 1–3 after flip)
- Manage stretch—keep lights at equal distance.
- Data points: number of main tops, internode spacing, leaf health, EC in/out, pH.
Mid Flower (Week 4–6)
- Bud building time.
- Data points: bud density (score 1–5), trichome “frostiness” (score 1–5), aroma intensity (score 1–5), EC in/out, pH, water intake.
Late Flower / Ripening (Week 7+)
- Keep the same ripeness cues for both groups (pistil color, trichome heads).
- Data points: days to target ripeness, any foxtailing, fade quality.
Quality Scoring Rubric (1–5 Scale)
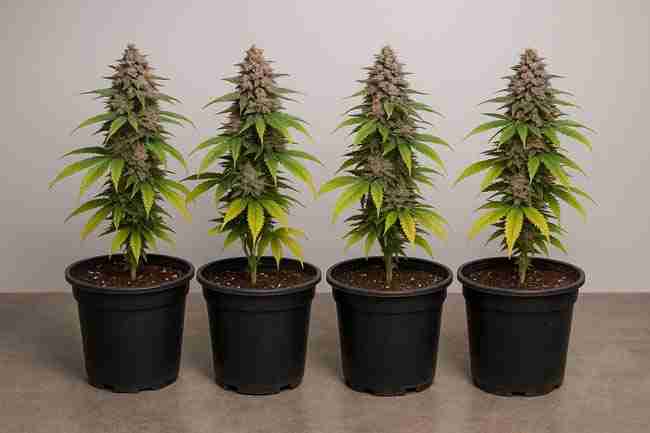
Use the same simple scale for both groups.
- 1: Weak (airy buds, off smells, visible issues)
- 2: Below average (light, inconsistent density)
- 3: Average (fine, but not exciting)
- 4: Good (dense, resinous, strong aroma)
- 5: Excellent (chunky, loud aroma, very resinous)
Score separately for:
- Bud density
- Resin/frost
- Aroma intensity
- Bag appeal
Harvest, Dry, Cure: Keep It Identical
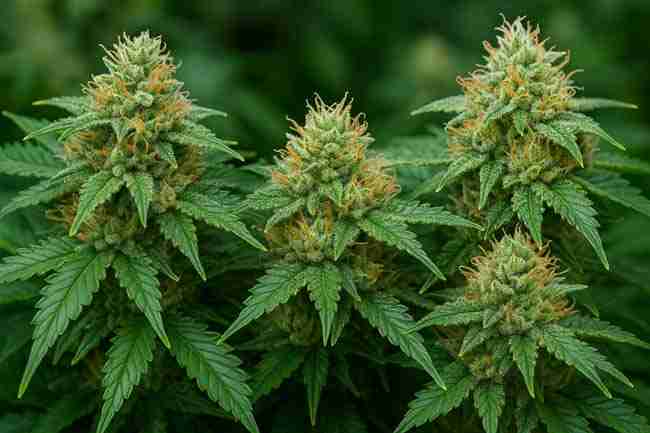
Drying and curing can make or break your test. If A dries too fast and B dries slow, your comparison gets shaky.
Simple, steady drying
- Temp: ~60–65°F (15.5–18°C)
- RH: ~55–60%
- Airflow: gentle, not blasting
- Darkness: yes
- Time: 7–14 days, depending on bud size and environment
Curing
- Use the same jars and fill level.
- Burp schedule: identical for A and B.
- Weigh the dry yield after stems snap (not bend).
What to Measure (Quant + Qual)
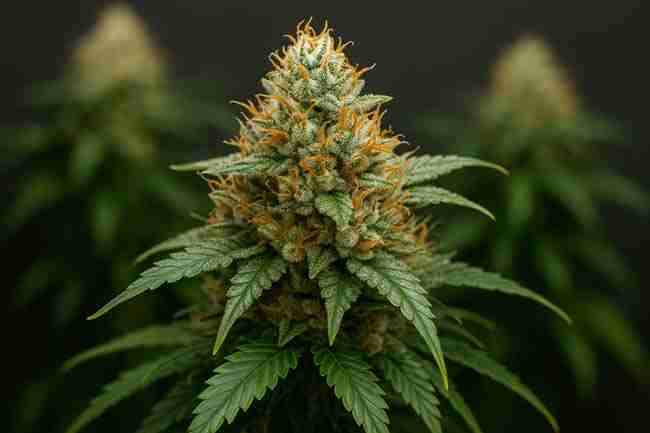
Write it all down. Future you will thank you.
Quantitative (numbers)
- Dry yield per plant (g)
- Yield per square foot (g/ft²) if you track canopy
- Yield per watt (g/W) if lights are the same and measurable
- Days to harvest
- Water used per week
- EC in / EC out and pH
- Runoff % (if soil/coco with runoff)
Qualitative (scores)
- Bud density (1–5)
- Frostiness (1–5)
- Aroma intensity (1–5)
- Ease of trim (1–5)
- Clean burn/ash (post-cure) (1–5)
Crunching the Numbers (Without Headaches)
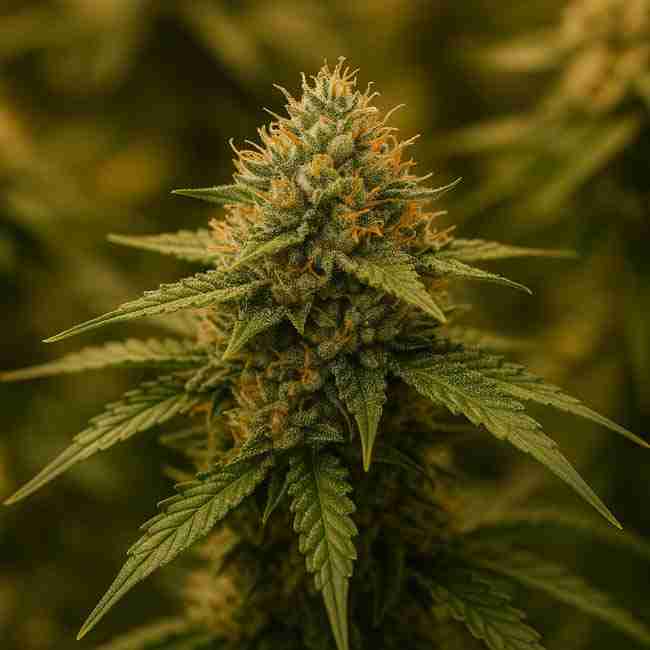
You don’t need to be a statistician. Averages do a lot.
Simple steps
- Average yield for Group A (add all A yields, divide by A plant count).
- Average yield for Group B.
- Compare: (B average – A average) / A average × 100 = % difference.
- Do the same with density, frost, and aroma scores.
Interpret gently
- If B beats A by 10%+ on yield and also looks/smells better, that’s strong.
- If yield is the same, but B has better quality scores, that can still be a win.
- If A looks better but yields the same, weigh your priorities.
Example: A Real-World cannabis AB test Story
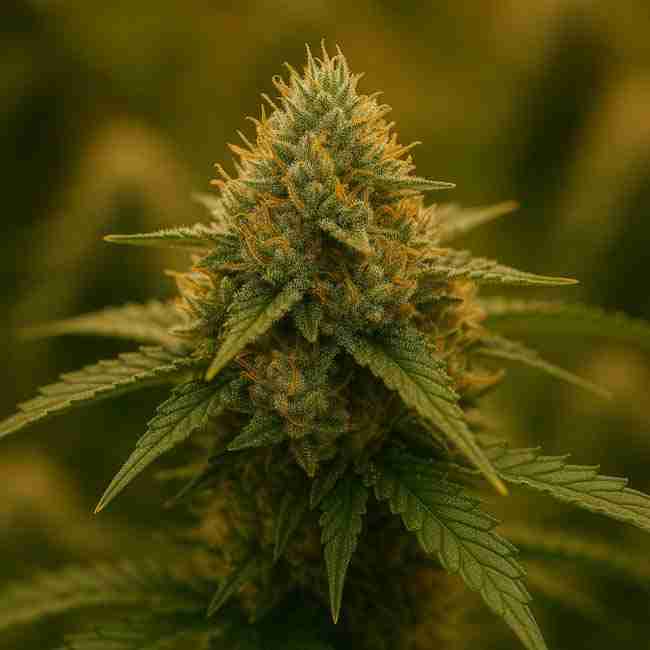
You run two groups of clones from the same mom.
- Group A: Your usual two-part nutrients.
- Group B: A three-part line (same brand family) with a mild bloom booster.
You hold light at the same PPFD, same pot size, same CO₂ (ambient), same pH targets. You track EC in/out and keep runoff between 10–15%.
What you notice:
- In mid flower, B shows slightly deeper green and thicker calyx stacks.
- Tip burn is tiny on B (you used a conservative booster dose).
- At harvest, B yields 11% more on average and scores higher on density and frost.
Decision: Switch to B or keep A for ease/cost if A is cheaper and the difference doesn’t matter to you. That’s the beauty—you choose based on your goals.
Common Pitfalls (And How to Dodge Them)
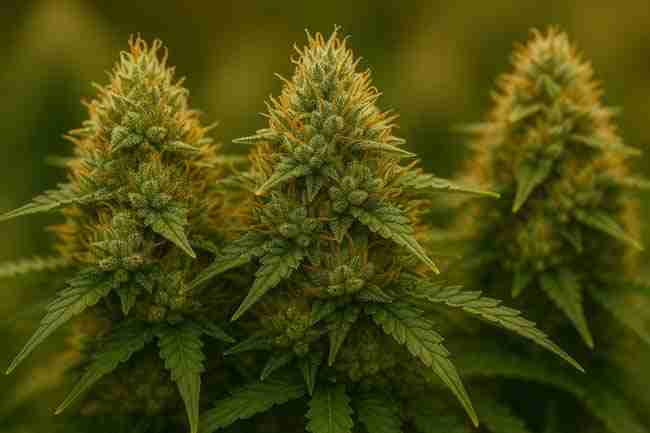
Changing too many things
Don’t switch nutrients and pot size and light timing. That’s not an AB test—that’s chaos.
Poor labels
Plants forget who they are. You shouldn’t. Label everything: A1, A2, B1, B2.
Uneven light
Measure canopy intensity. If B sits in a hotspot, the test lies.
Inconsistent pH or EC
If Group A gets 1.8 EC and Group B gets 2.4 EC by accident, you’re testing dose, not brand.
Bias in judging
Do a blind sniff test with a friend after cure. Mark jars on the bottom, not the lid.
Scaling Up: A/B/n and Staggered Tests
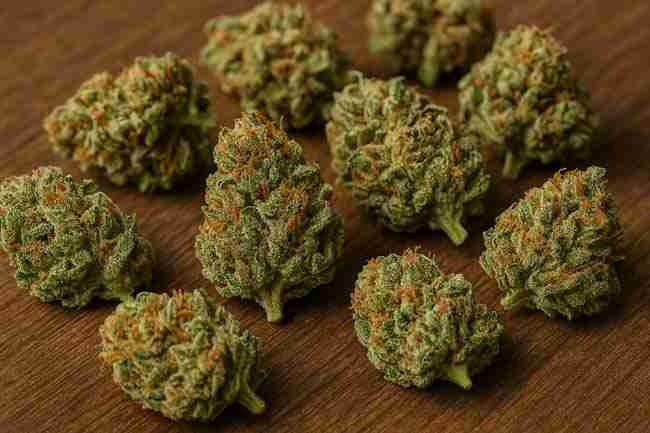
Once you’re comfy, you can compare A vs. B vs. C (that’s A/B/n). Keep replicates lower or split the tent across multiple cycles. Or run staggered tests: A vs. B this run, winner vs. C next run. Small steps, big insights.
What to test later
- Cal-Mag brands
- Silica (dose levels)
- Microbial inoculants
- Bloom boosters
- Flush strategies (timing)
- Dry/cure tweaks (only after you master nutrient ABs)
Budget & Time: What It Takes
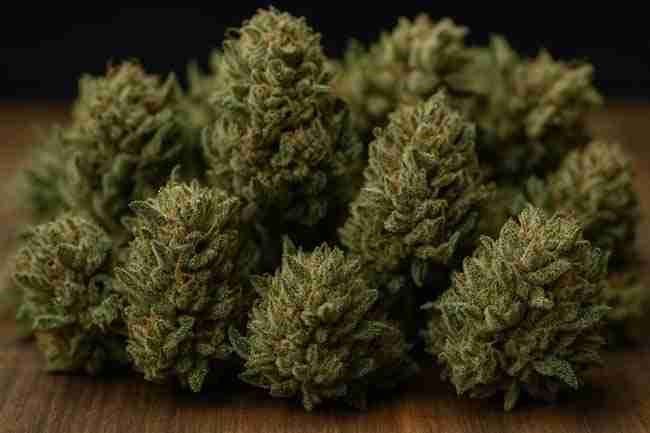
Table: Typical home AB test toolkit and cost (ballpark)
| Item | Purpose | Budget Range |
|---|---|---|
| pH meter + storage | Accurate pH | $$ |
| EC/TDS meter | Nutrient strength | $$ |
| Thermo-hygrometer | Track temp/RH | $ |
| Light meter (lux/PPFD) | Even canopy | $–$$$ |
| Measuring tools | Dose precisely | $ |
| Labels/markers | Keep order | $ |
| Scale (grams) | Dry yield | $–$$ |
| Notebook/app | Logs | $ |
Time: Add ~5–10 minutes per feeding for measurements and notes. Totally worth it.
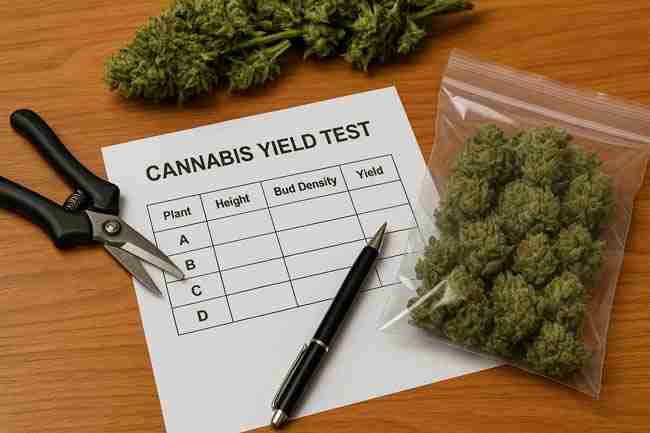
Data Sheet Template (Copy, Print, Use)
Daily/Feed Log (per plant):
- Date:
- Plant ID: A1 / A2 / B1 / B2 …
- Feed EC (in):
- Runoff EC (out):
- pH in / pH out:
- Water volume:
- Height / Node count:
- Notes (tips, color, smells):
Weekly Summary (group-level):
- Average height:
- Average EC in/out:
- Water used:
- Photo taken? (Y/N)
- Any issues:
Table: Simple harvest comparison (fill your numbers)
| Metric | Group A | Group B |
|---|---|---|
| Days to harvest | ||
| Avg dry yield per plant (g) | ||
| Yield per sq ft (g/ft²) | ||
| Density score (1–5) | ||
| Frost score (1–5) | ||
| Aroma score (1–5) | ||
| Ease of trim (1–5) | ||
| Notes |
Specifications (Targets That Keep You Honest)
These are plain, steady targets you can hold for most photoperiod cultivars. Adjust slightly for your genetics and medium.
Environment
- Veg temp: 72–78°F (22–26°C)
- Flower temp: 68–76°F (20–24°C)
- RH veg: 55–65%
- RH flower: 45–55% (lower late)
- VPD: ~0.8–1.2 kPa veg; ~1.2–1.5 kPa flower
Light
- Veg PPFD: ~300–500 µmol/m²/s
- Flower PPFD: ~700–900 µmol/m²/s (home tent sweet spot)
Nutrition (guideline EC)
- Seedling: 0.4–0.6 EC (including water)
- Veg: 1.0–1.6 EC
- Early flower: 1.6–1.8 EC
- Mid/late flower: 1.8–2.2 EC (strain dependent)
- Runoff: Keep within ~0.2–0.4 EC of input
pH Ranges
- Coco/hydro: 5.7–6.2 (aim 5.8–6.0)
- Soil: 6.2–6.8 (aim ~6.5)
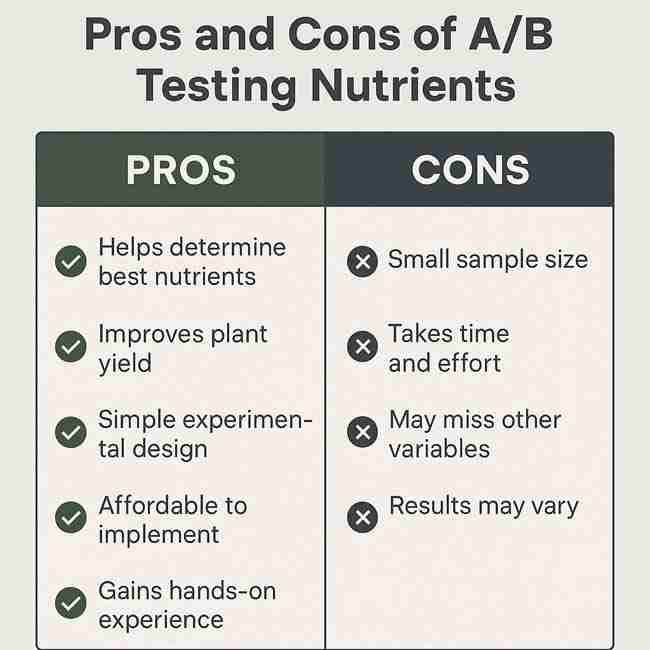
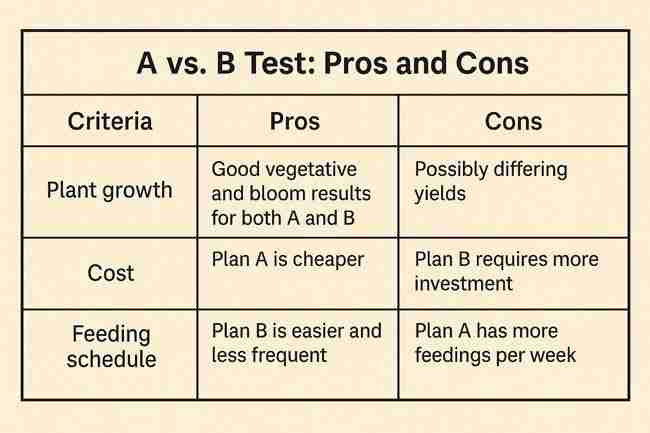
Pros and Cons of Running a cannabis AB test
Pros
- Real answers, not guesses
- Better yields and quality with the same gear
- Confidence to invest in what works
- Cleaner troubleshooting for future problems
Cons
- Takes extra time to measure and log
- Needs space for replicates
- You must resist changing other variables
- Results can be subtle; patience required
Troubleshooting During the Test
Tip burn shows up (both groups)
- Your overall EC might be hot. Back off both groups evenly (keep the comparison fair).
Only Group B is taco-ing leaves
- B’s feed may be strong for that recipe. Lower B by ~10–15% and note it. You’re still testing a nutrient plan—doses are part of the plan.
pH drift in runoff
- Confirm meter calibration. Check mixing order. Ensure equal dry-back between groups before feeding.
Uneven growth speed
- Rotate plant positions. Confirm light uniformity.
“Nutrient comparison grow” vs. Real Life
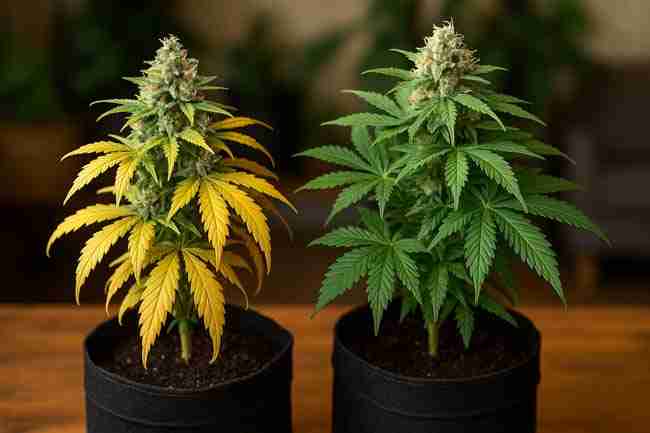
A nutrient comparison grow is still a normal grow—you’ll train, defoliate, and water like you always do. The hack is to do those actions equally on both sides. If you top A, top B the same day and same way. If you lollipop A, lollipop B to the same node.
How to Turn Results into Action (No Overthinking)
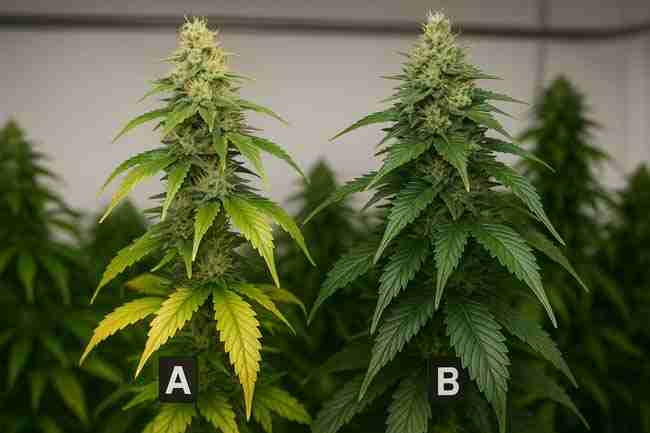
- If B wins big on yield and quality → Switch to B for your next run.
- If B wins on yield only but loses on flavor → Decide what matters to you (you can also tweak B’s dose next run).
- If A and B tie → Pick the cheaper, simpler, or more available option. Your time is worth money.
- If both underperform → Your limiting factor might be light, temp, or VPD—not nutrients. Fix the bottleneck, then retest.
Frequently Asked Questions (FAQ)
What is a cannabis AB test in plain English?
A cannabis AB test compares two nutrient plans (A vs. B) with everything else the same, so you can see which one grows better plants.
How many plants do I need for a nutrient comparison grow?
Use at least 3 per group. If you can, go 4–5. More plants make the results less shaky.
Can I run a cannabis AB test with seeds instead of clones?
Yes, but try to increase replicates and pick uniform seedlings. Clones are best for clean comparisons.
What should I measure for a solid yield test design?
Track dry yield per plant, EC in/out, pH, water use, days to harvest, and quality scores (density, frost, aroma). That’s a strong yield test design for home grows.
My two groups look different mid flower—should I tweak doses?
If one group is clearly unhappy (tip burn, clawing), make small, noted adjustments to that group’s plan. Record the change. You’re testing real nutrient use, not fake perfection.
How long should I run the test?
From veg start to the end of cure. Dry and cure affect quality, so finish the whole cycle before deciding.
Should I keep the winner forever?
Keep it for now. Re-test occasionally when you change other big variables (lights, environment, genetics). What wins in winter might not win in summer.
Can I test additives alone?
Yep. Keep your base the same for both groups and add the new product only to B. Same dose timing each feed.
Your Step-by-Step Action Plan (Do This)
- Write the question (A vs. B—what are you testing?).
- Choose clones (or more seeds) and set replicates (3–5 per group).
- Print both feed schedules; tape them up.
- Label plants A1–A5 and B1–B5; randomize positions.
- Calibrate meters; measure source water.
- Mix feeds the same way every time; record EC/pH and runoff.
- Log weekly pictures and scores (density, frost, aroma).
- Harvest identically; dry/cure identically.
- Weigh dry yield per plant; compute group averages.
- Decide: switch, tweak, or keep the champion.